

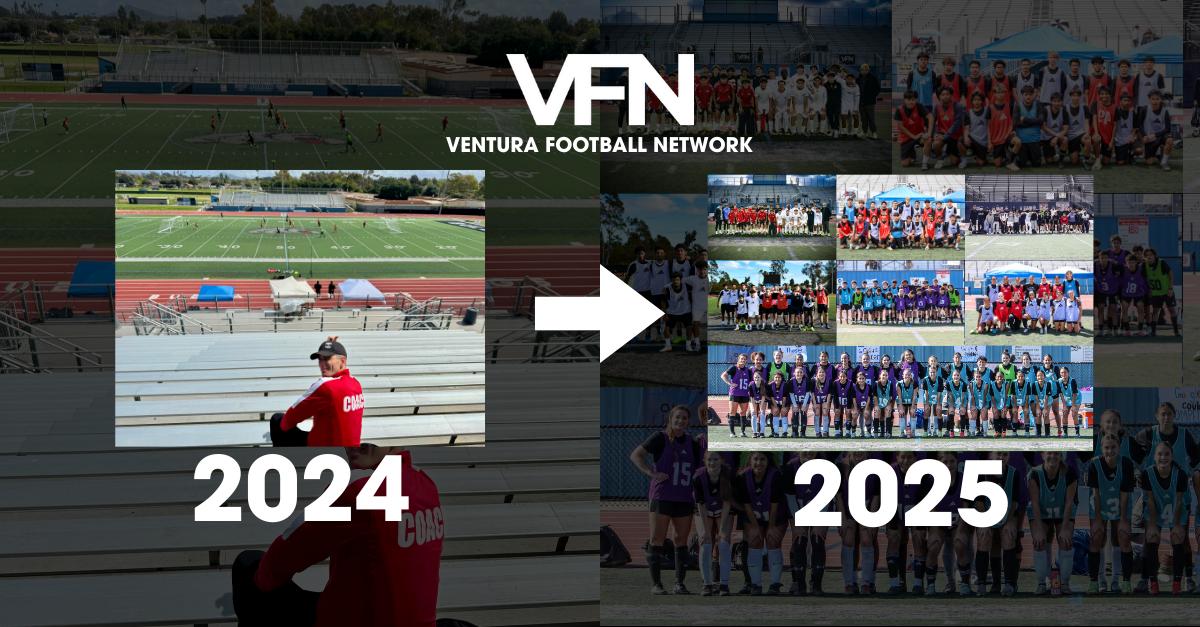
Year One vs. Year Two: What Real Growth Looked Like at Ventura Football Network
When Ventura Football Network (VFN) launched, growth was never the primary goal.
Impact was.
Year one was about proving the mission mattered. Year two was about proving it could scale without losing its values.
With two full years of data now available, here’s what that growth actually looked like.
Year One (2024): Building the Foundation
Year one focused on legitimacy, trust, and proof of concept.
We were answering a simple question: Would people support a community-first, nonprofit football model built around access and opportunity?
Digitally, Year 1 was modest but intentional:
~70,000 people reached
~4,000 link clicks
~7,500 website visits
~$1,350 in total ad spend
On the website:
6,316 visits
5,190 unique visitors
11,279 pageviews
$1,335 in revenue
These weren’t viral numbers but they were high-intent numbers. People weren’t just seeing VFN; they were clicking, learning, and beginning to support the mission.
Year one proved the mission.
Year Two (2025): Scaling Without Losing the Mission
By year two, the foundation was in place.
The community understood what VFN stood for:
Access
Opportunity
A commitment to breaking down pay-to-play barriers
That clarity allowed us to scale responsibly.
Digitally, Year 2 delivered:
1.25M+ total views
200,000+ people reached
6,300+ link clicks
20,000+ website visits
1,600+ new followers
$1,815 in total ad spend
On the website:
13,520 visits (+114%)
10,490 unique visitors (+102%)
22,592 pageviews (+100%)
$3,272 in revenue (+145%)
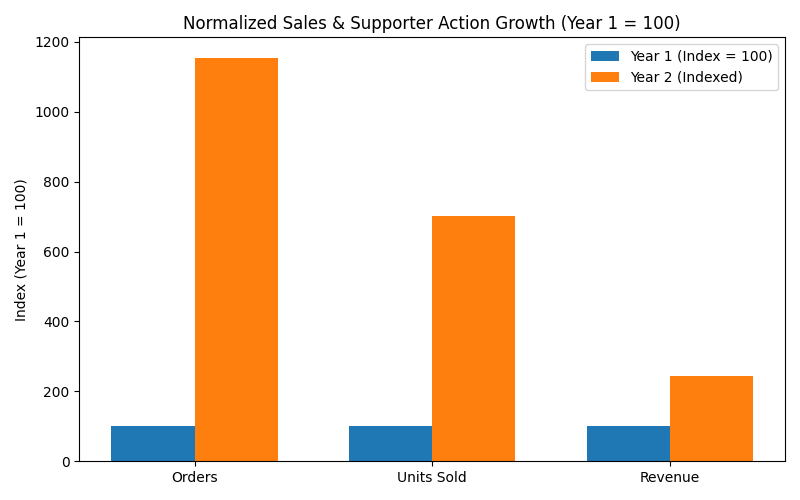
Orders increased over 1,000%
This wasn’t just more traffic, it was more action.
Year two proved the model.
Looking at Growth Honestly (Why Normalization Matters)
To keep comparisons honest, we normalized performance by indexing Year 1 = 100 across metrics.
This allows us to compare growth rates, not just raw size.
Digital Reach Growth (Year 1 = 100)
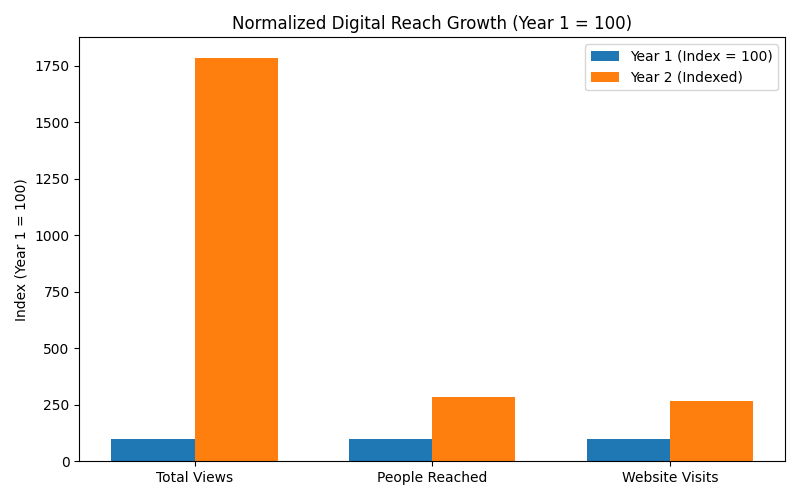
What this shows
Total views grew ~18×
People reached grew ~2.9×
Website visits from social grew ~2.7×
Awareness didn’t just increase, it scaled.
Website Performance Growth (Year 1 = 100)
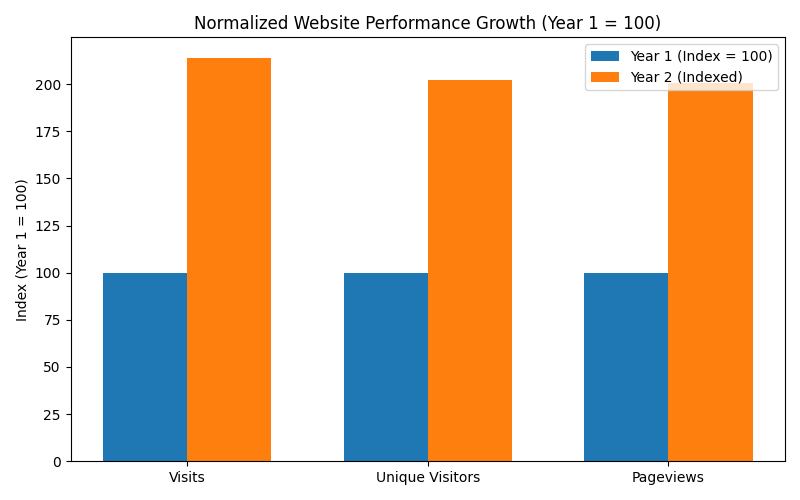
What this shows
Visits doubled
Unique visitors doubled
Pageviews doubled
Growth was balanced and healthy, not inflated by a single metric.
Supporter Action & Revenue Growth (Year 1 = 100)
Engagement Quality > Follower Count
One of the most important insights from year two is how the audience engages.
VFN currently maintains a total follower base around the nonprofit median but performance tells a deeper story.
4× the average engagement compared to similar nonprofit accounts
64th percentile in follower growth, indicating steady, healthy expansion
Audience built organically through content and community storytelling not paid follower acquisition
On average, VFN now generates:
100,000+ content views per month
11,000+ average reach per month
3,000+ content interactions per month
For partners and sponsors, this means access to:
A highly active audience
Strong message retention
Authentic community trust
Growth doesn’t need to be massive to be meaningful. It needs to be real.
Understanding the Audience: Instagram vs. Facebook
VFN’s platforms serve different but complementary roles.
Instagram: Engagement & Momentum
~1,650 followers
Primarily ages 25–44
Strong concentration in Ventura County and Greater Los Angeles
High engagement driven by players, families, and community members
Instagram is where VFN builds momentum, visibility, and connection.
Facebook: Trust & Decision-Makers
Smaller audience (~130 followers)
Skews older (25–54+)
Nearly 30% of followers based in Ventura, CA
Strong representation among parents, donors, coaches, and local leaders
Facebook is where VFN builds trust, credibility, and long-form understanding.
Together, these platforms create a full-funnel ecosystem:
awareness → engagement → trust → action.
What Changed Between Year One and Year Two?
1. Clarity Scales
In year one, people asked “What is VFN?” In year two, they already knew.
Clear missions grow faster.
2. Trust Drives Conversion
The biggest shift wasn’t reach, it was behavior. Visitors became supporters. Supporters returned. Trust compounded.
3. Efficiency Over Volume
With under $2,000 in total digital spend, VFN:
Doubled website traffic
Increased revenue by 145%
Increased orders by 1,000%+
That level of efficiency is intentional and necessary for a grassroots nonprofit.
Why This Comparison Matters
This isn’t about celebrating numbers.
It’s about proof of concept.
It shows that:
Community-first sports initiatives can scale
Transparency builds trust
Small budgets can create meaningful impact
Mission-led growth is sustainable
This matters to partners, sponsors, grant organizations, and anyone investing in long-term community impact.
Looking Ahead to Year Three
Year one proved the mission.
Year two proved the model.
Year three is about multiplying the impact.
If you’re interested in supporting, partnering, or building with Ventura Football Network, we’d love to connect.